Plastic Pollution —
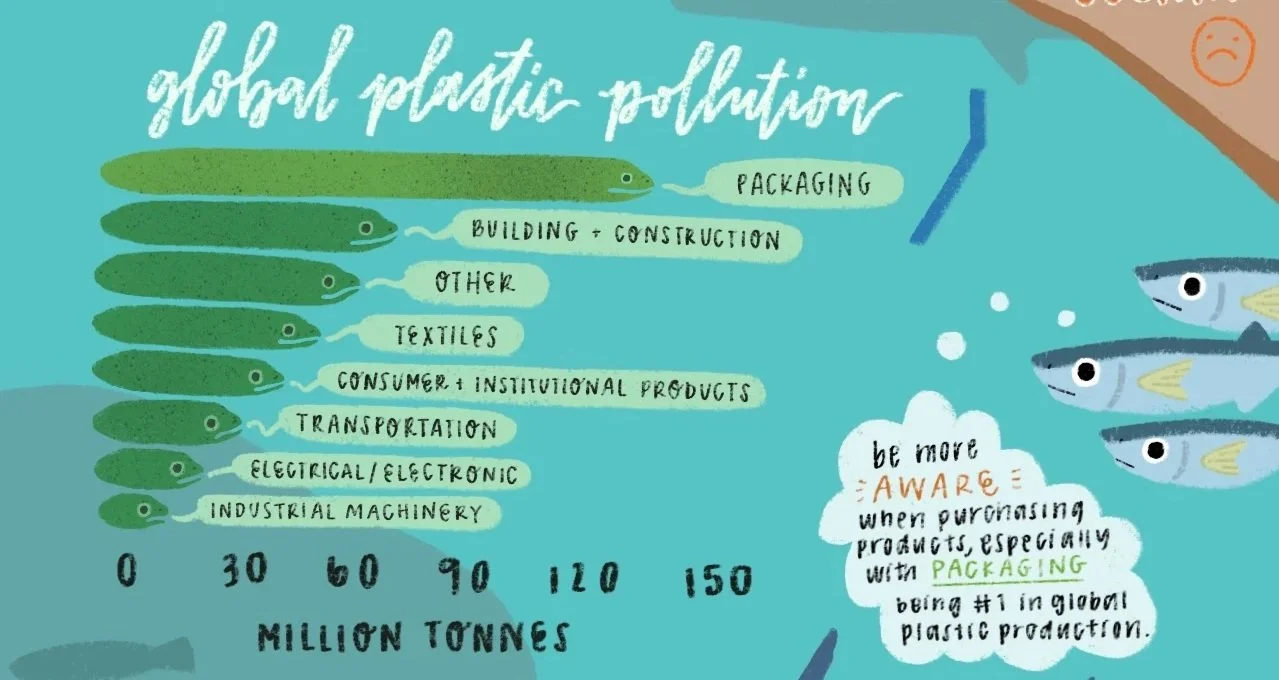
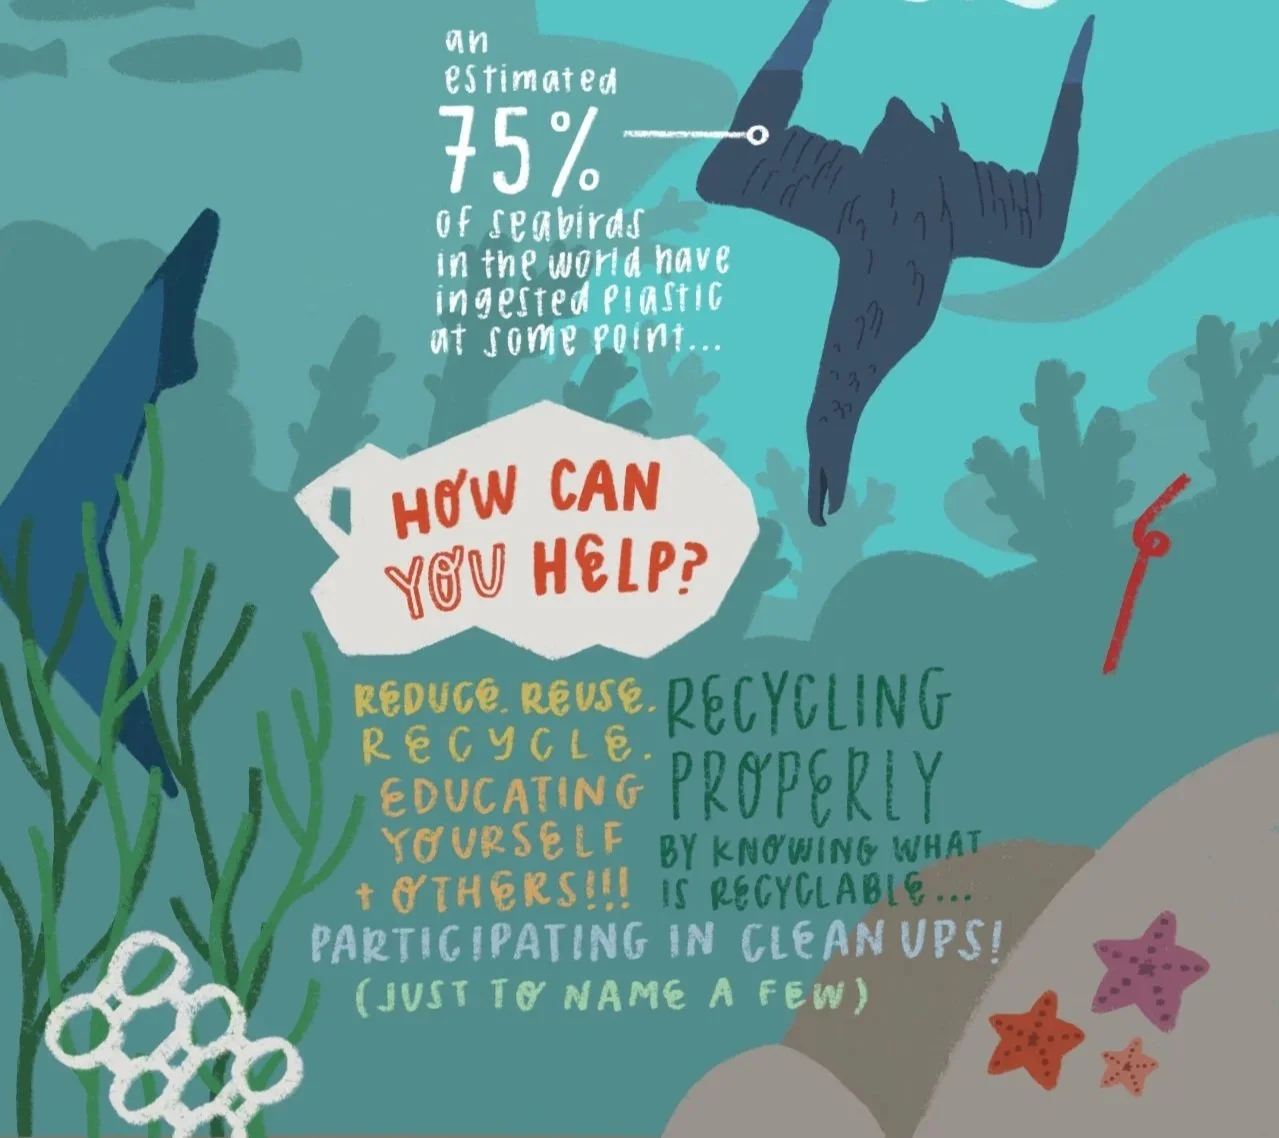
During my graduating year of college, I took a data visualization class with little to no knowledge what it was about. For the last half of the term, our data visualization class focused on plastic pollution and its effects on the world. As a result, one of the final projects for the class was to make an infographic on plastic pollution. To this day, this infographic was one of my favorite projects from the class as it not only allowed me the most creative freedom, but also because I learned a lot in regards to plastic pollution and how much it has impacted our world and continues to do so.
Course: Data Visualization
Professor: Laurie Burruss
Illustrator & Designer: Amy Ng